April closings ran 104.5 percent of ask, the strongest of the year, on only ten sales
Ten Warren homes closed in April at a median of $930,000 and an average of $1,280,000. Seven of ten went at or over ask. Sellers took 33 new listings, the most of any month in 2026.
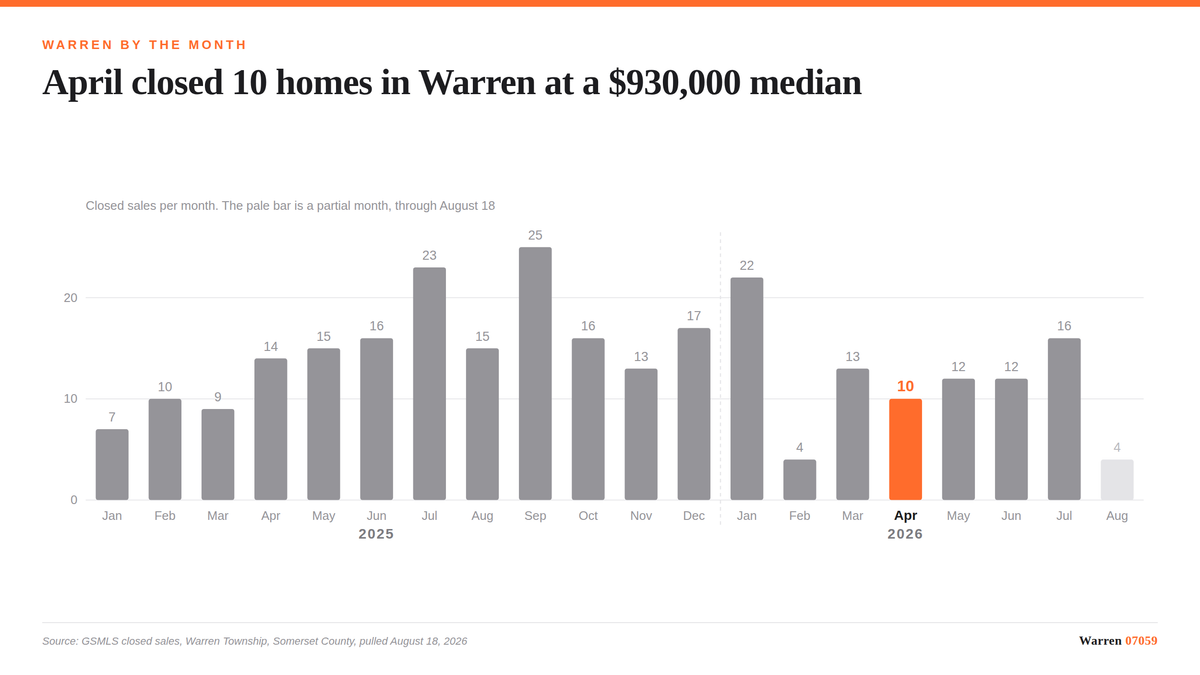
Ten homes closed in Warren Township, Somerset County in April 2026 at a median of $930,000 and an average of $1,280,000. Median days on market was 22 and the average sale closed at 104.5 percent of ask, the strongest figure of 2026 so far and tied with March 2025 for the strongest in the record to date. Seven of the ten closed at or over ask, in a range from $675,000 to $2,485,000. April 2025 by comparison saw 14 closings at a $1,125,000 median, 23 median days on market and 101.0 percent of ask, with nine of 14 at or over ask.
April 2026 against April 2025
| April 2026 | April 2025 | |
|---|---|---|
| Closings | 10 | 14 |
| Median price | $930,000 | $1,125,000 |
| Median days on market | 22 | 23 |
| Average percent of ask | 104.5 | 101.0 |
| Closed at or over ask | 7 of 10 | 9 of 14 |
Volume is down four closings, which on a base of 14 is a large percentage and a small absolute number. Ten sales is a thin month. Any median drawn from ten transactions moves on the composition of those ten homes as much as on market conditions, and you should read the $930,000 median with that in mind.
What did not thin out is competition on the homes that traded. The average sale closed at 104.5 percent of ask against 101.0 a year earlier, and median days on market held at 22 against 23. Buyers who engaged in April engaged quickly and paid over ask more often than not.
The median and the average are $350,000 apart
This is the number worth explaining, because it is the one most likely to get misread.
April's median was $930,000. April's average was $1,280,000. The average sits about 37.6 percent above the median, and that ratio is mine, calculated from the two published figures.
A gap that size does not mean the middle of the market is at $1,280,000. It means a small number of high sales pulled the average up. April's range ran from $675,000 to $2,485,000. With only ten transactions in the month, two or three sales near the top of that range are enough to lift the mean well above the middle while leaving the median untouched. Ten sales, and the average is consistent with roughly $12.8 million of closed volume for the month.
Compare April 2025, when the median was $1,125,000 and the average was $1,147,343, a gap of about 2 percent. That is what a month looks like when the mix is even. April 2026 is not that month.
The practical point: if you are trying to place your own house against April's data, the median is the more useful of the two figures, and even it is carrying a ten sale sample.
Supply is the other April story
Warren sellers took 33 new listings in April 2026 at a median original ask of $960,000.
Two things about that. First, 33 is the highest count of any month in 2026 so far and the second highest in the record to date, behind the 36 taken in May 2025. Second, the $960,000 median ask is the lowest of any full month in 2026 to date, against $1,175,000 in January, $1,395,000 in February and $1,250,000 in March.
April 2025 for comparison took 30 new listings at a median ask of $999,000. So the count is up three year over year and the median ask is down about $39,000.
That combination is a mix effect more than a pricing signal. A month with a lower median ask means more of the homes that came on were positioned below a million dollars, not that sellers cut prices. The record does not support the second reading.
Spring is when Warren inventory arrives
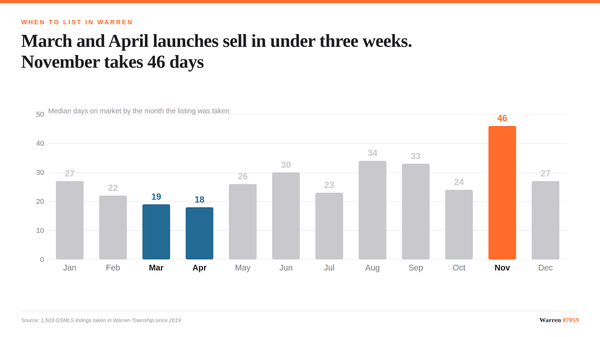
The listing counts by month make the pattern plain. In 2025 the spring window ran 19 new listings in March, 30 in April and 36 in May, and April and May together carried more new inventory than any other two month pair of the year. 2026 has now opened its spring the same way, with April's 33 the largest month so far.
One full spring cycle plus a second one in progress is a short record, so I would call April and May the likely peak window rather than calling April the single peak month.
If you are deciding when to go on, that seasonality cuts both ways and the data does not resolve it for you. Listing in April puts your house in front of the year's largest pool of active buyers, and it also puts it next to the year's largest pool of competing houses. Listing outside the window means fewer competitors and fewer buyers. April 2026 sold at 104.5 percent of ask with 33 homes coming on in the same month, which says the buyer pool absorbed that supply without discounting.
All figures come from Garden State MLS records for Warren Township, Somerset County, queried through my BigQuery warehouse on August 18, 2026, excluding superseded listing records. Days on market is the MLS field and reflects the current listing only, so a home relisted after a withdrawal shows a shorter history than it actually had. Monthly counts in a town Warren's size are small, and April 2026 has ten closings, so treat single month medians as indicative rather than precise. New listing counts are grouped by list date, closings by close date, so the two tables do not describe the same homes. These figures cover every residential property type in the MLS, including townhouses and condominiums, not detached houses alone. Attached product sells below detached in Warren, so a detached only median would run higher.
- GSMLS data for Warren Township, Somerset County, via the author's BigQuery warehouse, pulled August 18, 2026. https://www.gsmls.com