Four homes closed in Warren in February. The number worth watching is 17.
February produced 4 Warren closings against 10 a year earlier, a sample far too small to read a median from. New listings went the other way, 17 against 11, at the highest median original ask in the record to date.
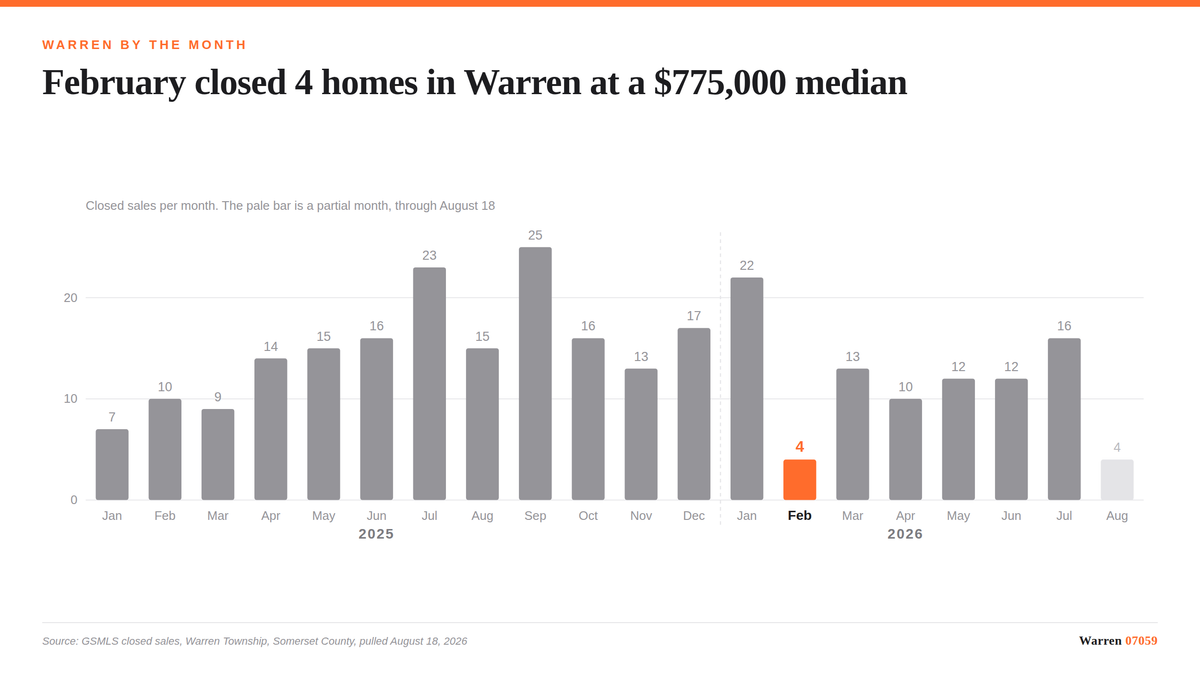
Four homes closed in Warren Township in February 2026, against 10 in February 2025. The median closed price was $775,000 with a median 33 days on market and an average of 99.2 percent of ask, but on four sales those figures carry almost no statistical signal and should not be read as a price move. The more informative number is supply: 17 new listings were taken in February 2026 against 11 a year earlier, at a median original ask of $1,395,000, the highest monthly median ask in the record to date.
What February actually recorded
| Measure | Feb 2026 | Feb 2025 |
|---|---|---|
| Closings | 4 | 10 |
| Median closed price | $775,000 | $833,303 |
| Average closed price | $1,066,000 | $951,330 |
| Median days on market | 33 | 18 |
| Average percent of ask | 99.2 | 100.7 |
| Closed at or over ask | 2 of 4 | 5 of 10 |
| Range | $679,000 to $1,520,000 | not shown |
Now the part most monthly recaps skip.
Four sales is not a market
A median of four numbers is the average of the middle two. In February 2026 that means the entire headline price figure was determined by two transactions. Move either one, and the median moves with it.
The full range that month ran from $679,000 to $1,520,000. That is a spread of more than $840,000 across four houses, which in Warren is the difference between a small older house and a large one. When four sales span that much ground, the midpoint of them describes which four houses happened to close, not what Warren homes are worth.
So the honest statement about the $775,000 median is that it is a fact about February's four closings and nothing more. It is not evidence that prices fell. It is not evidence that they held. The sample cannot support either claim, and anyone presenting it as a trend line is overreading it.
The same caution applies to the rest. A median 33 days on market and 99.2 percent of ask are real measurements of four transactions. Two of the four closed at or above ask. On four events, the difference between two and three is 25 percentage points, which tells you how little a percentage means here.
Below roughly ten closings in a month, treat the median as a description of those specific sales and nothing more. Warren months routinely fall under that line in winter. Use rolling periods or year to date figures when you need a price read.
Closings and listings are measuring different months
This is the core of it. A closing that recorded in February was, in most cases, a house that went under contract weeks earlier, in December or January. Closings are a lagging record.
A new listing is a decision made this month. It tells you what sellers are doing right now.
In February 2026 those two series pointed in opposite directions. Closings fell by six year over year. New listings rose by six, from 11 to 17.
That divergence is not a contradiction. It is what happens when a small number of older contracts settle in the same month that a larger number of owners decide to come to market. The closing count is telling you about early winter. The listing count is telling you about February.
The listing number, and the ask attached to it
Seventeen new listings in February is a substantial figure for a Warren winter month. For comparison, February 2025 produced 11 and December 2025 produced 6.
The median original ask on those 17 was $1,395,000. That is the highest monthly median original ask in the entire record I maintain, which begins in January 2025.
Two things could produce that, and the data alone does not separate them. Either sellers as a group set higher expectations in February, or the specific mix of houses that came to market that month skewed toward larger and more expensive properties. A median ask reflects the composition of what was listed as much as the pricing posture of who listed it.
What it does establish is that inventory arrived. For a buyer who spent the winter looking at a thin list, February added seventeen names to it, weighted toward the upper end.
The civic context, which is not an explanation
Two things happened in Warren's municipal life in February that touch anyone trying to transact locally.
Town Hall was closed for essentially the entire month after a sprinkler pipe broke at the Municipal Building on February 8. And the Township extended the first quarter property tax grace period to February 13 through Resolution 2026-087, on the stated ground that the closure may have delayed taxpayers through no fault of their own.
I am raising those because they are practical context for anyone who needed a municipal record, a permit or a counter transaction during February. I am not offering them as a cause of the four closing count. No causal link between the Town Hall closure and February's sales volume is established anywhere in the record, and the timing argument runs the wrong way regardless, since most February closings were contracted well before February 8.
Where these numbers come from, and what they exclude
All sales figures here come from Garden State MLS data for Warren Township in Somerset County, filtered to exclude superseded records, pulled on August 18, 2026 from my own warehouse. Two limits you should know about.
Days on market is the MLS field, which reflects the current listing only. A house that was withdrawn and relisted shows the shorter clock, not the full marketing history.
MLS data covers listed and reported sales. It does not capture unlisted private transfers, and a small number of recorded prices in any dataset of this kind are not arms length transactions.
What to watch next
For March, the number to check first is not the median price. It is whether the seventeen February listings convert. New listings reach the closing series a few months later, which puts these in the spring counts. If a meaningful share go under contract, the spring closings will reflect it. If they sit, the inventory number keeps climbing and the ask figures become the thing to watch.
These figures cover every residential property type in the MLS, including townhouses and condominiums, not detached houses alone. Attached product sells below detached in Warren, so a detached only median would run higher.
- GSMLS data for Warren Township, Somerset County, via the author's BigQuery warehouse, pulled August 18, 2026. https://www.gsmls.com
- Township of Warren, Resolution No. 2026-087. https://warrennj.org/DocumentCenter/View/11372