Warren closed 23 homes in July 2025, its busiest month yet, at the lowest median since March
Twenty three homes closed in Warren in July 2025 at a median of $915,000 and 97.9 percent of ask, the weakest figure of the year so far. July 2024 closed 17 at a $1,355,000 median.
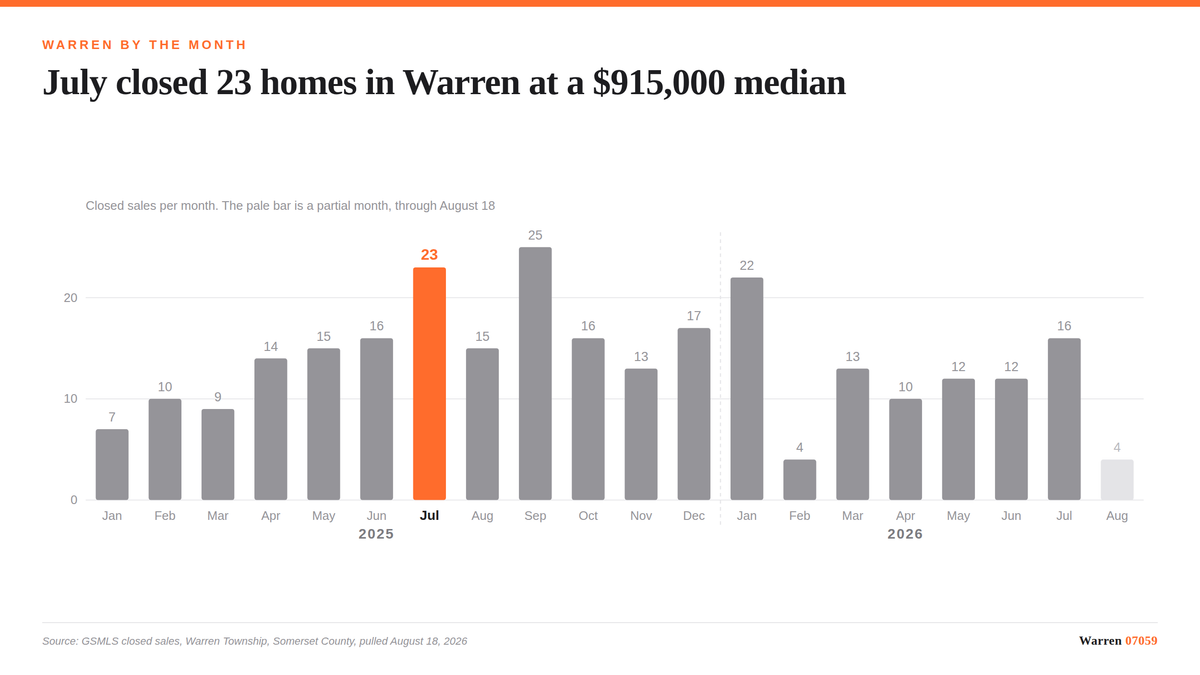
Twenty three homes closed in Warren Township in July 2025, more than in any other month of the year to that point, at a median price of $915,000 and an average of $942,552. Median days on market was 25 and the average sale closed at 97.9 percent of ask, the lowest figure of any month in 2025 so far and the first month below 100 percent since January. Eleven of the 23 closed at or over ask. In July 2024 Warren closed 17 homes at a median of $1,355,000, so volume rose and the median fell against the same month a year earlier.
July gave Warren its highest closing count of any month so far and its lowest median since March, in the same month. Those two facts describe one thing, which is what kind of house closed.
The month
| Measure | Jul 2025 | Jun 2025 | May 2025 |
|---|---|---|---|
| Closings | 23 | 16 | 15 |
| Median price | $915,000 | $1,257,000 | $1,250,000 |
| Average price | $942,552 | $1,360,500 | $1,323,777 |
| Median days on market | 25 | 14 | 14 |
| Average percent of ask | 97.9 | 102.9 | 100.7 |
| Closed at or over ask | 11 of 23 | 10 of 16 | 8 of 15 |
| High sale | $1,875,000 | $2,550,000 | $2,398,750 |
| New listings taken | 23 | 17 | 36 |
The low end of July's recorded range is left out of that table on purpose. The lowest figure in the record for the month is $106,621, which does not look like an arms length sale, so I have excluded it from the discussion here. The median is unaffected by it either way.
The year over year comparison
The source behind these recaps now carries a 2024 monthly table, which it did not carry when the January through June posts in this series were written. Those earlier recaps said no year over year comparison was available. From this post forward one is, with the limits noted at the end.
| Measure | Jul 2025 | Jul 2024 |
|---|---|---|
| Closings | 23 | 17 |
| Median price | $915,000 | $1,355,000 |
| Median days on market | 25 | 24 |
| Average percent of ask | 97.9 | 103.5 |
Six more sales, a median $440,000 lower, the same time on market, and five and a half points less at the negotiating table. The days on market figures being almost identical is the useful part. Houses were not sitting longer in July 2025 than in July 2024. They were different houses, and they gave up more at the end.
What a falling median measures
The median is the midpoint of what closed. It moves when the composition of the month changes, and July's composition changed in a way you can see without guessing.
Median price per square foot in July 2025 was $416, computed on 15 of the 23 closings, which is 65 percent coverage. The same figure for July 2024 was $387, computed on all 17 of that month's closings. The midpoint sale price fell by about a third year over year while the midpoint price per foot did not fall at all. That combination points at smaller and less expensive houses closing, not at a lower price on the same house.
I am not calling that a trend. Fifteen properties in one month and 17 in another is not a sample that supports one. It is enough to say that the drop in the median is not, by itself, evidence of a price decline.
Supply
Twenty three new listings came on in July at a median original asking price of $925,605. That is the lowest median original ask of any month in 2025 so far, below April's $999,000 and well below May's $1,290,000.
For the first time this year the listing side and the closing side matched in count. Warren has now taken 144 new listings in 2025 against 94 closings.
Percent of ask compares the sale price to the list price in effect when the contract was signed, not to the original asking price. A month at 97.9 percent means the typical sale settled about two points under the standing ask. Eleven of 23 sales still met or beat it, so the month was not uniformly soft. The average was pulled down by the other twelve.
The author's read
Labeled as opinion and kept separate from the figures above. The number I would watch out of July is not the median. It is 97.9 percent of ask arriving in the same month as the year's highest volume. Through June, more sales had come with stronger pricing. July broke that pairing. One month does not establish anything, and August will say more about how the spring listing cohort cleared.
These figures cover every residential property type in the MLS, including townhouses and condominiums, not detached houses alone. Attached product sells below detached in Warren, so a detached only median would run higher.
All figures come from GSMLS closed sale and listing records for Warren Township, Somerset County, filtered to exclude superseded listing records. This recap was compiled for the archive from a warehouse pull dated August 18, 2026. Warren Township is in Somerset County and is not Warren County. The 2024 monthly figures come from a slightly different superseded filter than the 2025 figures and can differ by a sale or two in a given month, so treat the year over year comparison as directional. Average price, at or over ask counts and the high and low sale are not available for 2024 and are not stated for it here. Days on market is the MLS field and reflects the current listing only. New listing counts are by list date. Sales that never went through the MLS do not appear at all.
Figures are deemed reliable but are not warranted. Nothing here is a valuation of any particular property.
- GSMLS data for Warren Township, Somerset County, via the author's BigQuery warehouse, pulled August 18, 2026. https://www.gsmls.com